|
R e s e a r c h
T h e B O A C L a b r a d o r s i g h t i n g of J u n e 2 9, 1 9 5 4
Martin SHOUGH
Appendix A
(i) Hourly Data Report for June 29, 1954, SEPT-ILES A, QUEBEC
All times are specified in Local Standard Time (LST). Add 1 hour to adjust for Daylight Saving Time where and when it is observed.
(ii) Sept Iles Almanac - Averages and Extremes for June 29, 1954 (all recorded
(iii) Hourly Data Report for June 29, 1954, KUUJJUAQ A, QUEBEC
All times are specified in Local Standard Time (LST). Add 1 hour to adjust for Daylight Saving Time where and when it is observed. (iv) Daily Data Report for June 1954, KUUJJUAQ A, QUEBEC
M = Missing
(v) Kuujjuaq A, Almanac - Averages and Extremes, June 29, 1954 (all recorded
[Source: Canadian Weather Office.] (vi) 641st AC&W Sq USAF weather report, Goose AFB, Labrador A telex timed 01:50 Z from 641st Airborne Control & Warning Squadron stationed at Goose AFB contains the terse codes: CLEAR/VIS 30/73/4B/3013/NNW 8 which does not conform exactly to the format required under Air Force Regulation 200-2 for weather data to be collected in cases of UFO observations, but can probably be translated as follows:
Weather clear The conspicuous omissions are the temperature, the time of the observations, and the exact source. Compare the Hourly Data Report for Goose archived by the Canadian Weather Office [Appendix A (vii) below] which relates to the joint military/civil airfield of Goose Bay (Goose AFB) as distinct from the nearby facilities of Pepperell AFB centred around the former St John's Airport. Comparison of pressure and RH alone tends to suggest that the USAF report is probably of an early-morning observation (local time), since which time surface pressure had been falling slightly from its high of >1020 mbar. But none of the hourly observations at Goose corresponds exactly with the values recorded in the 6641st AC&W telex - presumably this may be because the USAF and Weather Office records relate to different observations made at different times at different (albeit nearby) airfields. (vii) Hourly Data Report for June 29, 1954, Goose A Newfoundland
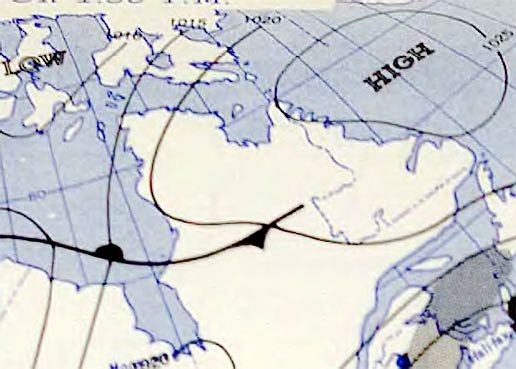
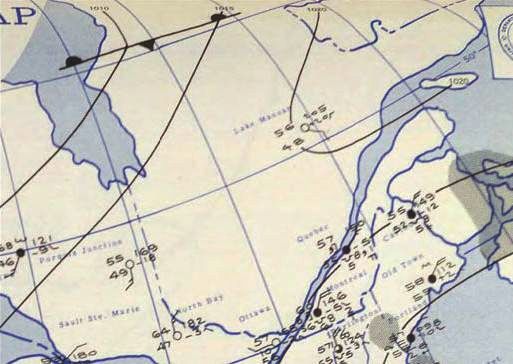
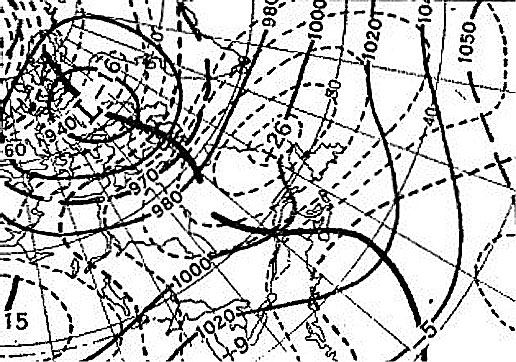
All times are specified in Local Standard Time (LST). Add 1 hour to adjust for Daylight Saving Time where and when it is observed. (viii) US Weather Bureau surface pressure charts, 29-30 June 1954 (Click pictures below to enlarge)
(ix) US Weather Bureau 500mbar (~19,000 ft) constant pressure chart,
Detail from contour map of the 500 mbar pressure surface based on radiosonde observations begun between 10:00 p.m. and 11:00 p.m. (EST) June 29, 1954 and collected by 01:30 a.m. (EST) June 30, 1954. 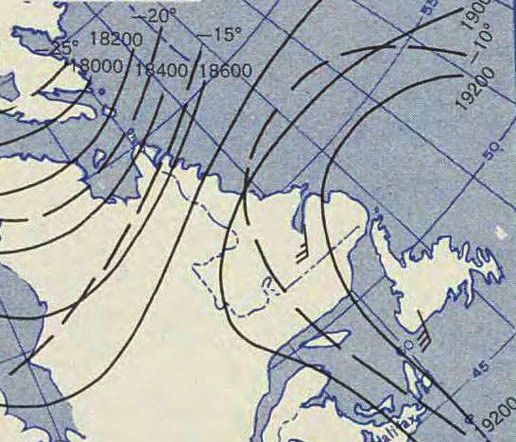
Continuous lines show height in feet above sea level. Dashed lines show temperature in degrees Celsius. Wind barbs show direction and force in knots.
(x) Mean 700-mbar winds, June 1-30, 1954 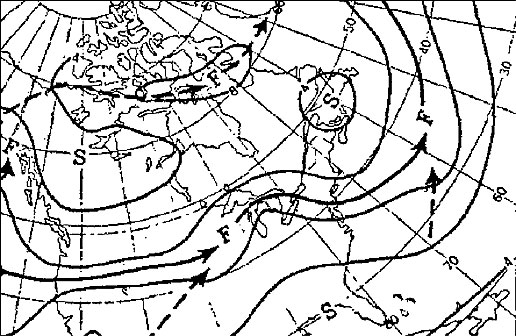
A. Mean 700-mbar (~10,000 ft) isotachs (meters per second). Solid arrows indicate average position of the mean 700-mbar jet stream, while dashed arrows indicate secondary axes of relative maximum wind speed. 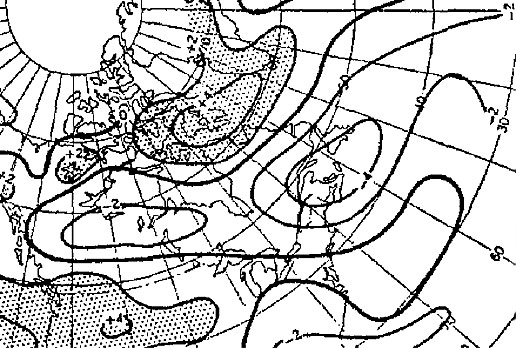
B. Departure from normal wind speed (in meters per second) The mid-latitude westerly jet was strong in the East Pacific but abnormally weak in the Atlantic averaging 6 m/sec (12 kt), between -2 and -4 m/sec (-4 to -8 kt) below normal.
(xi) Mean 700-mb height contours (solid lines) and departure from normal
Dashed contours in the centre of the chart show a pronounced positive pressure-height anomaly of +260 ft coinciding with the slow-moving "blocking anticyclone" over Labrador, with low pressure (negative height anomaly averaging -160 ft over the month) dominating to the northwest.
|
||||||||||||||||||||||||||||||||||||||||||||||||||||||||||||||||||||||||||||||||||||||||||||||||||||||||||||||||||||||||||||||||||||||||||||||||||||||||||||||||||||||||||||||||||||||||||||||||||||||||||||||||||||||||||||||||||||||||||||||||||||||||||||||||||||||||||||||||||||||||||||||||||||||||||||||||||||||||||||||||||||||||||||||||||||||||||||||||||||||||||||||||||||||||||||||||||||||||||||||||||||||||||||||||||||||||||||||||||||||||||||||||||||||||||||||||||||||||||||||||||||||||||||||||||||||||||||||||||||||||||||||||||||||||||||||||||||||||||||||||||||||||||||||||||||||||||||||||||||||||||||||||||||||||||||||||||||||||||||||||||||||||||||||||||||||||||||||||||||||||||||||||||||||||||||||||||||||||||||||||||||||||||||||||||||||||||||||||||||||||||||||||||||||||||||||||||||||||||||||||||||||||||||||||||||||||||||||||||||||||||||||||||||||||||||||||||||||||||||||||||||||||||||||||||||||||||||||||||||||||||||||||||||||||||||||||||||||||||||||||||||||||||||||||||||||||||||||||||